Reservoir Monitoring

Weekly reservoir storage, from the waterline.

Water-surface polygons and estimated stored volume for every reservoir on your watchlist, refreshed each week from wide-swath satellite imagery.

Spec table

GSD
10–30 m, wide-swath
Cadence
weekly
Platform
wide-swath satellite
Spectral
multispectral
Coverage
any reservoir on your watchlist, worldwide
Formats
GeoPackage for polygons, CSV for the series
Delivery unit
one series per reservoir, plus a basin roll-up
Schematic reservoir outline at full-supply level, with a smaller drawn-down outline inside it full-supply levelthis week
Schematic: full-supply outline and a drawn-down week.

The files

File

Water-surface polygon

Format
GeoPackage
What's in it
One polygon per reservoir per week, with the acquisition date of the scene it was mapped from. Weeks with no usable scene are flagged, never filled. A standard GIS format that loads into your own tooling.
Cadence
weekly
File

Estimated stored volume

Format
CSV
What's in it
One row per reservoir per week: date, mapped surface area in km², estimated volume in hm³ and the scene date. Volume comes from your reservoir's area-capacity curve, so it appears only where a curve has been supplied or is public. Otherwise the row carries surface area alone.
Cadence
weekly
File

Basin roll-up

Format
CSV
What's in it
Estimated volume summed across the watchlist for a basin or portfolio of dams, weekly, with a count of how many reservoirs had a usable read that week. A roll-up built on partial reads says so.
Cadence
weekly
File

Drawdown series

Format
CSV
What's in it
The back record for each reservoir on the watchlist, so you can set this season's drawdown against earlier ones. Depth of record depends on the imagery archive for the site and is checked before the project is agreed.
Cadence
back record

How it works

  1. 01You send

    List your reservoirs

    Send the watchlist as names and coordinates, or as outlines in GeoPackage or shapefile. Add the area-capacity curve for any reservoir where you hold one, as a CSV of area against volume.

  2. 02We run

    Weekly pass

    Each week the wide-swath multispectral imagery over your reservoirs is checked for a clear view of the water.

  3. 03We run

    Polygon and volume

    Water is segmented in the clearest scene and the surface polygon is extracted. Where a curve exists, the polygon's area is looked up on it to give an estimated volume.

  4. 04You get

    Delivery

    The polygons, the volume series and the basin roll-up land on your project each week, in the formats above.

Limits

Condition

10–30 m is the floor

Effect on the delivery
At 10–30 m a pixel is 100 to 900 square metres of water surface. A large reservoir spans many pixels and reads cleanly. A small pond or pondage behind a run-of-river plant may cover only a handful, and its edge will be noisy or missing. Small reservoirs get surface area with a caution or are left off the watchlist.
Condition

Volume needs a curve

Effect on the delivery
Surface area to volume only works through the area-capacity curve. Without a usable curve we deliver surface area and say so. We don't estimate one.
Condition

An estimate, not a gauge

Effect on the delivery
The volume is satellite-derived. It is not telemetry and it is not a substitute for a level gauge. A reservoir with steep banks changes area little as the level moves, and the estimate is least sensitive there.
Condition

Cloud decides the week

Effect on the delivery
A cloudy week over a reservoir can delay that week's read. The pass is retried in the following days, and a week with no clear scene shows as a gap.
Condition

Weekly, not daily

Effect on the delivery
Cadence is weekly. Nothing here is a daily or real-time feed, so it won't catch a release made this morning.
Condition

Ice, shadow and vegetation

Effect on the delivery
Winter ice, terrain shadow and floating vegetation can hide or mimic open water. Affected weeks are flagged.

Why this exists

The storage number in your hydro balance is probably pieced together. Published filling data where a market has it, rainfall and snowpack proxies where it doesn't, and last year's annual report for the owners who say nothing.

Some dam owners disclose late, some never. You bid against that number, and nobody on the desk can check it against the water itself.

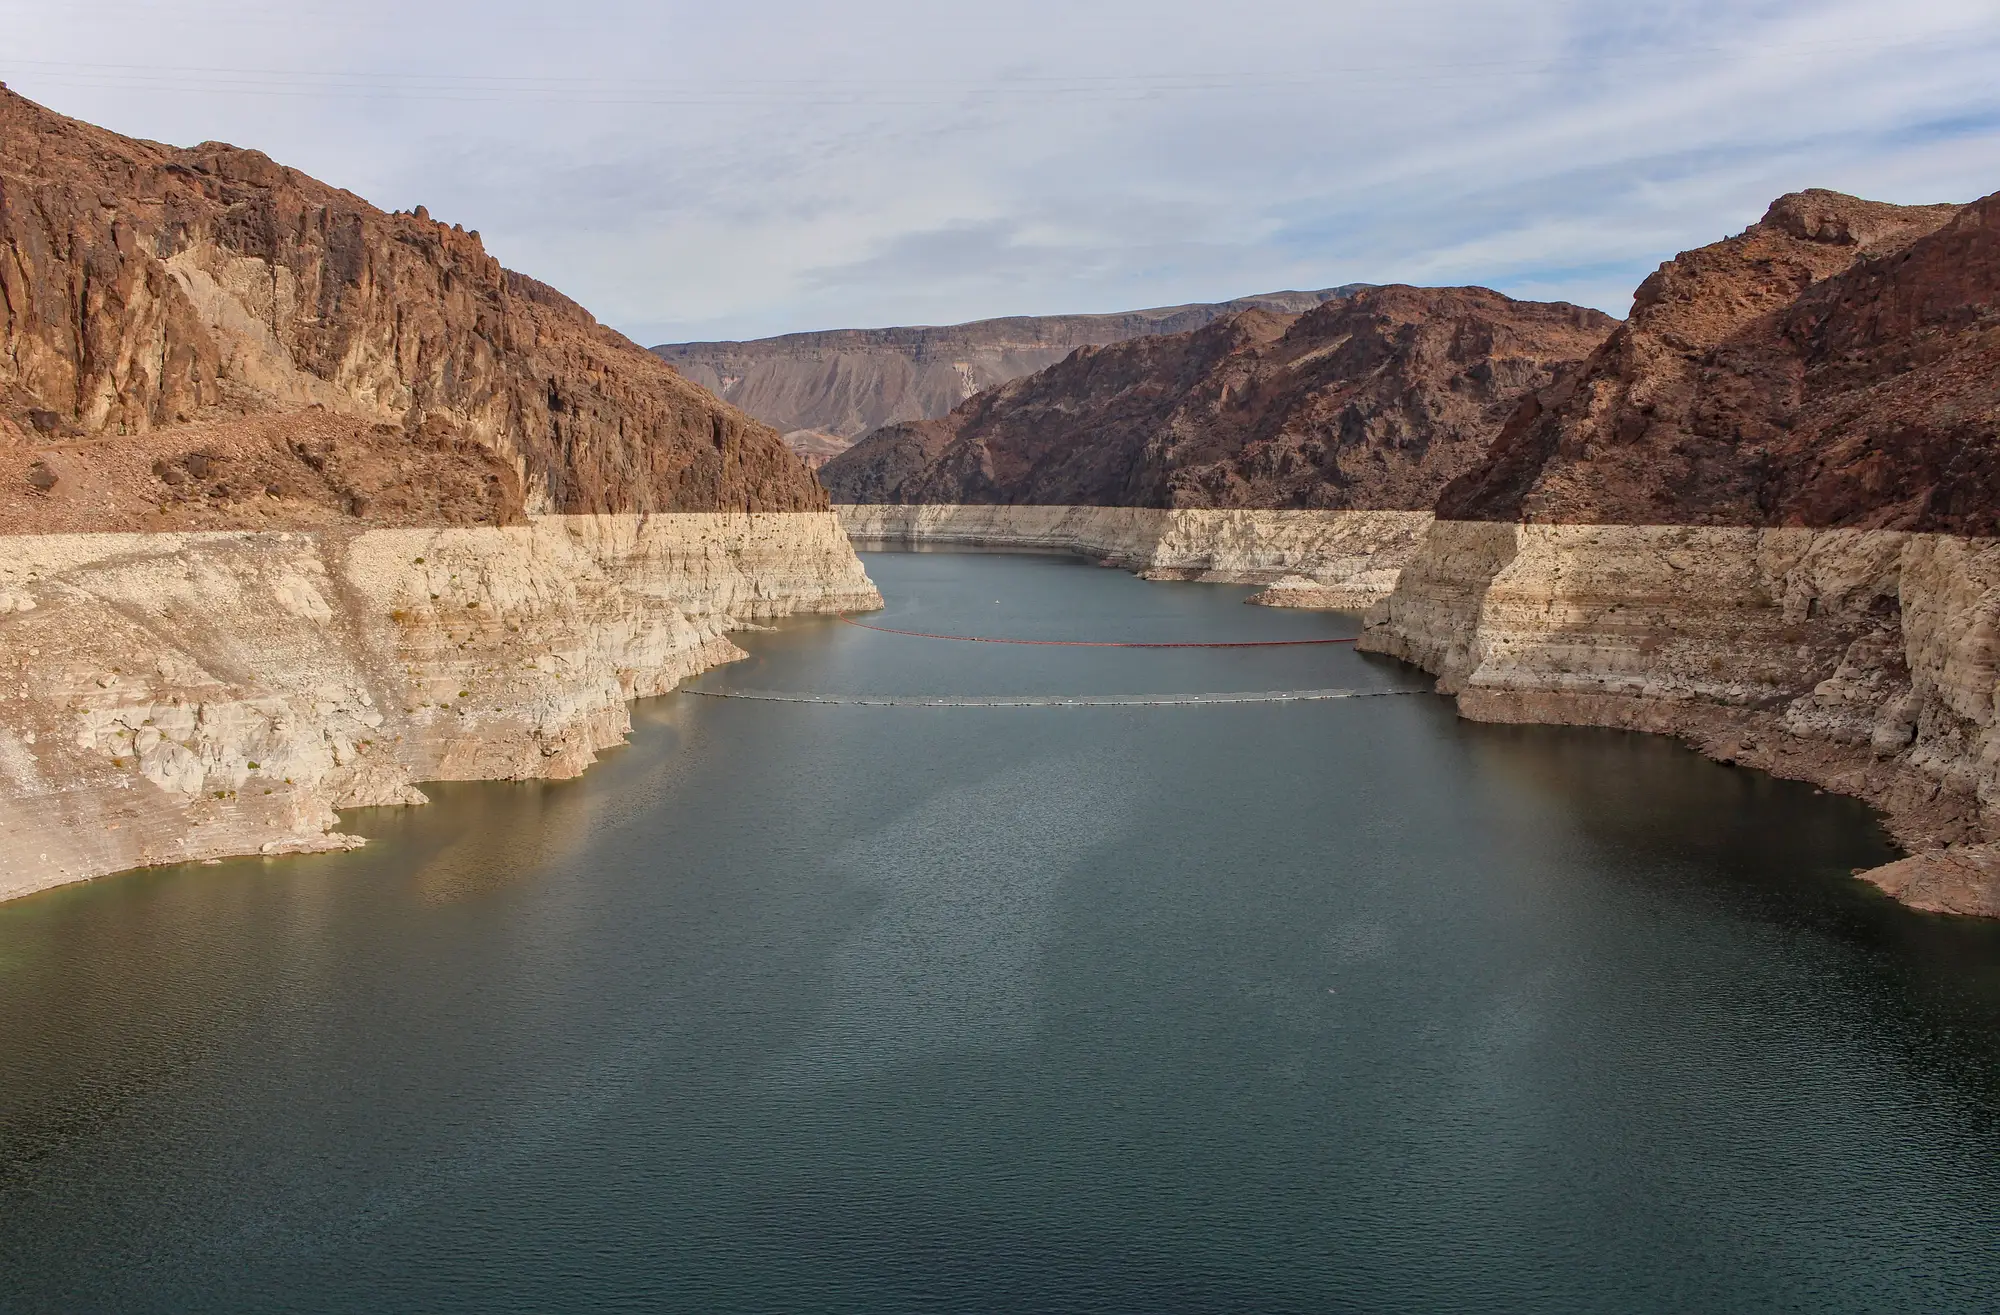
A desert reservoir drawn down, with a pale band of exposed rock above the waterline
Scenery. Old waterline on the rock above a drawn-down reservoir.

Who it's for

For

  • Power-trading and fundamental analysts who build a hydro balance and need a storage series per reservoir.
  • Grid-operations analysts watching storage across a basin or a portfolio of dams.
  • Desks whose regions publish storage late, patchily or not at all.

Not for

  • Desks that need gauge-grade or telemetry-grade level data. This is a satellite estimate.
  • Real-time or intraday storage. The cadence is weekly.
  • Dam-safety monitoring or structural inspection.
  • Runoff, inflow or price forecasting. This reports the waterline, not the outlook.
  • Very small reservoirs the pixel cannot resolve.

Questions from the desk

Is there a size limit?

Yes, a practical one. At 10–30 m GSD, small reservoirs cover too few pixels for a clean edge. The watchlist check tells you which of yours are too small before you commit.

Do you have the area-capacity curve for every reservoir?

No. We use a curve where you supply one or where a public one exists. Without it you get surface area only, with no volume.

How does it hold up against the levels we already see?

Every row carries its scene date, so you can lay the series beside owner disclosures, market filling data or your own gauge feed for the same week. Tell us where your reference data is when the project is scoped.

What about cloud cover?

A cloudy week can delay that week's read or leave a gap. Gaps stay gaps in the series.

Is this telemetry?

No. It is a satellite-derived estimate, and the volume depends on the curve behind it.

Can you cover any basin?

Worldwide, subject to imagery availability and, for volume, a usable curve. The archive is checked for your basin before work starts.

How does it plug into our models?

Plain CSV and GeoPackage, so it loads into your own models or a database table. There is no API to integrate before you can start.

Who owns the files, and what are the terms?

Use and ownership terms for what we deliver are written into the contract before work starts. Commercial terms are agreed when the watchlist is scoped.

Add your basin to the watchlist.

Send the reservoirs you track and we'll say which ones read cleanly at this resolution.

Start a project