How to estimate reservoir evaporation loss between satellite passes
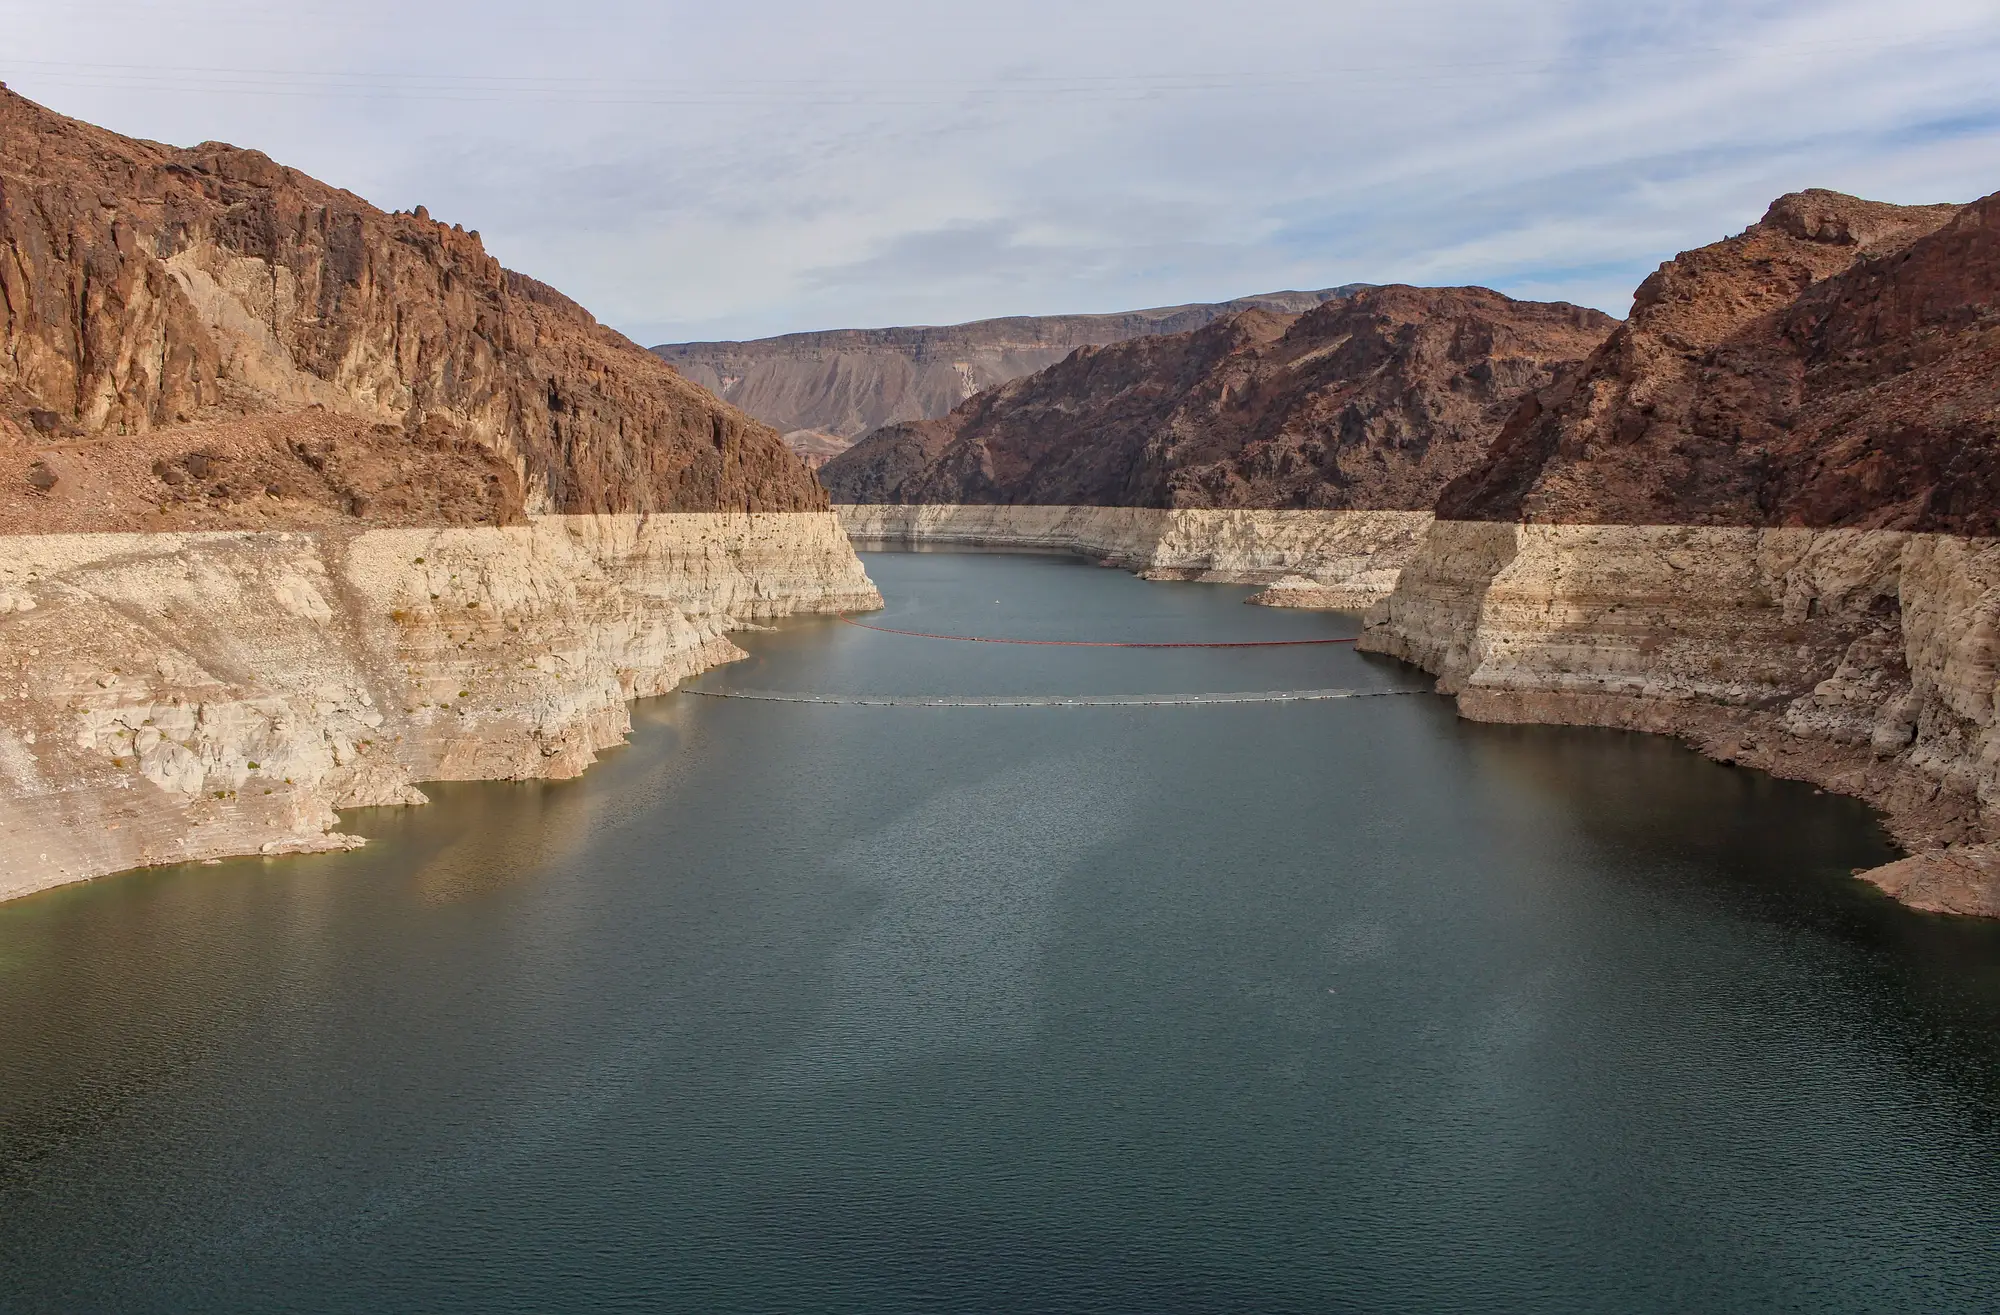
If you're tracking storage off a weekly polygon-to-volume series, you already know the uncomfortable part of the water balance: the satellite tells you storage on Tuesday and storage the following Tuesday, and everything that happened in between gets lumped into one number. Inflow, spill, turbine release, and evaporation all net out together. Of those four, evaporation is the one nobody measures directly at the reservoir, and it's the one that quietly throws off a net inflow calculation if you ignore it or guess wrong.
This matters more than it looks like on paper. A reservoir with a large surface area relative to its volume (a shallow, wide impoundment rather than a deep canyon fill) can lose a meaningful slice of weekly storage change to evaporation alone during a hot, dry, windy stretch. If you're backing out net inflow to forecast next week's generation capacity or to sanity-check a utility's release schedule, that loss term needs to be in the equation, not left as noise.
Why evaporation is the hardest term in the water balance
The basic water balance is simple to write down: change in storage equals inflow minus release minus spill minus evaporation (plus or minus seepage, which most analysts fold into a residual). Inflow and release can sometimes be cross-checked against gauge data or plant operations if you have access to them. Evaporation has no gauge sitting in the middle of the reservoir. It's a function of surface area, water temperature, air temperature, humidity, wind speed, and solar radiation, all of which vary day to day and all of which you're trying to estimate for a period you didn't observe.
The standard approach is to treat evaporative loss as a rate (depth per day, typically) and multiply it by the average surface area over the interval, then convert that volume loss into the same units as your storage change. The two hard parts are getting a reasonable daily rate and getting a reasonable average area when you only have area from two snapshot dates a week apart.
Pan evaporation vs satellite estimate
A pan evaporation station, where one exists near the basin, reports a daily open-pan loss in millimeters. Multiply that reading by a pan coefficient, commonly cited in the 0.6 to 0.8 range in hydrology references, to get the open-water rate, since a shallow metal pan loses heat and water faster than a large reservoir with more thermal mass behind it. That's a real, measured number. What it doesn't account for is the gap between the station and the water: a pan sited at an airport or ag research plot miles from the dam is reading different wind and humidity than the reservoir surface itself.
A satellite-based estimate skips the station entirely. It models evaporation from remote-sensing inputs, land surface temperature, incoming radiation, sometimes reanalysis weather fields, run against the reservoir's own footprint rather than a point location nearby. For a single dam with a good local pan record, the pan number is probably the better input. For a watchlist spanning several basins or countries, where half the reservoirs don't have a working station within a hundred miles, the modeled estimate is the one you can actually get consistently.
Most analysts use whichever one is available for a given reservoir and compare the two when both exist. Neither nails a single week exactly, but the error from either method is usually small next to the inflow signal you're trying to pull out, provided the area term behind it holds up.
Working it into a net inflow calculation
Once you have an evaporation volume for the interval, back-solve the water balance for net inflow: take your satellite-measured storage change, add back release and spill (from plant records or downstream gauge data if you have them), and add back the evaporation volume you just estimated. What's left is your net inflow estimate for that week, the number that feeds a generation or trading forecast.
For a lot of mid-size reservoirs, the evaporation term is where that final number loses the most accuracy, more than the storage-change measurement itself contributes. That's part of why we built Reservoir Monitoring to produce a weekly storage series straight from each reservoir's area-capacity curve, so an evaporation adjustment gets applied to a clean, consistent storage number instead of one stitched together from whatever disclosure a dam owner published last quarter.
If your net inflow math has been fighting stale or missing storage data more than it's been fighting the evaporation term, it's worth seeing what a weekly, basin-wide storage series looks like for your portfolio.