Satellite imagery vs. gauge station data for reservoir storage
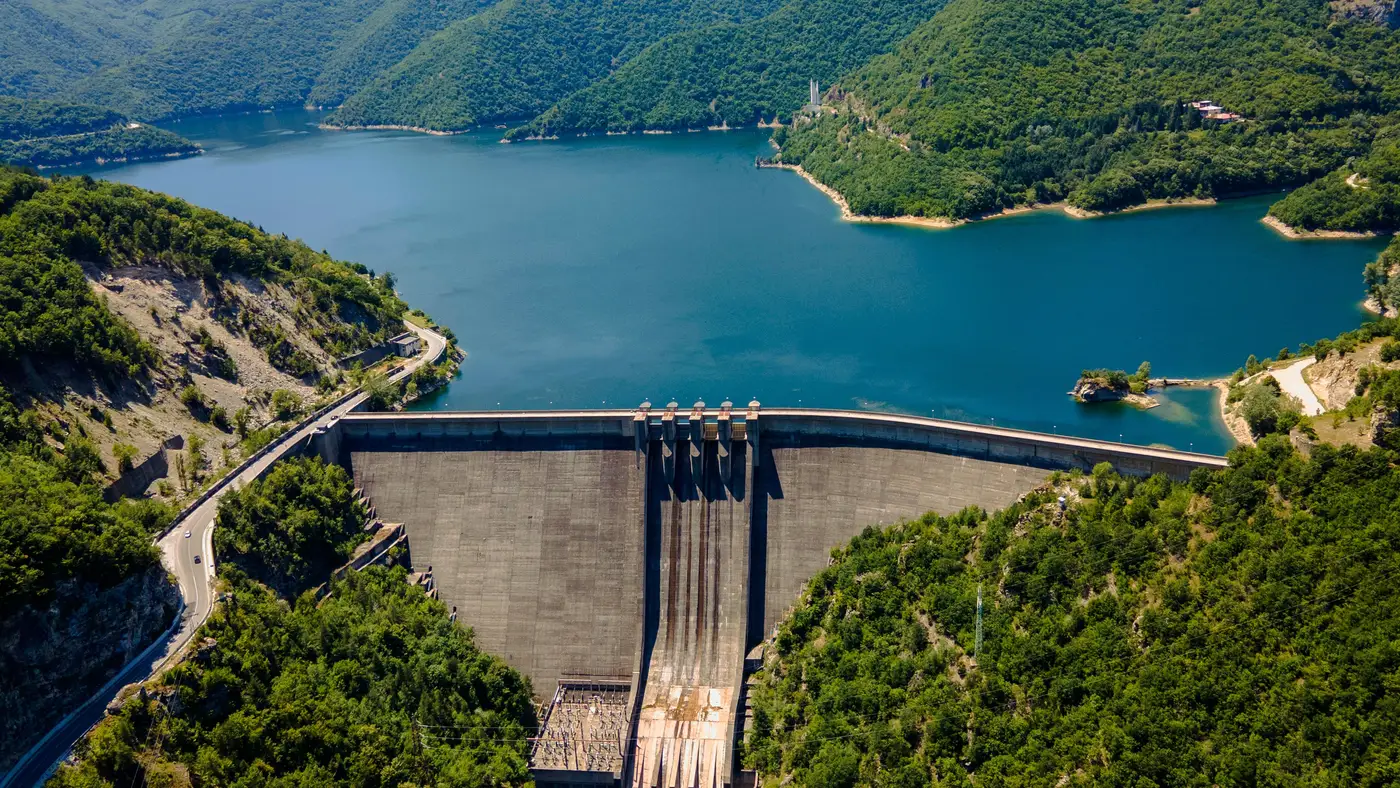
A forebay elevation reading from a staff gauge or pressure transducer is about as precise a number as you'll get on a reservoir, down to the hundredth of a foot on some SCADA feeds. A water-surface area pulled from a multispectral satellite pass is coarser, tied to pixel resolution and whatever clouds happened to be over the basin that day. So when a desk asks which source to trust for modeling storage across a portfolio of dams, the honest answer is that the two measure different things, and the gap between them is exactly where the disclosure problem lives.
What gauge data actually measures
A stream gauge or reservoir telemetry feed reports stage: the water surface elevation at one point, usually right at the dam. Run that elevation through the project's rule curve or elevation-storage table and you get an estimated acre-foot number. That conversion is solid when the table is current and the gauge is maintained. It breaks down when the bathymetry has silted in since the last survey, or when an operator stops posting updates during a drawdown they'd rather not explain to regulators or downstream water-rights holders.
The bigger problem for a trading desk is coverage. Gauge data exists only where someone installed a gauge and agreed to publish it. US basins run thick with USGS and state network stations. A lot of mid-size hydro assets, especially outside the US, especially ones owned by utilities with no legal obligation to file publicly, have no telemetry you can reach at all. You're reading last year's annual report, or you're reading nothing.
What satellite imagery actually measures
A wide-swath multispectral pass delineates the water-surface polygon, the actual shoreline extent of standing water, at whatever cadence the constellation revisits the site. Run that polygon through the reservoir's area-capacity curve, the surveyed relationship between surface area and stored volume, and you get a storage estimate without touching the dam owner's data feed at all.
The tradeoff is resolution and timing, not the underlying physics. A 10 to 30 meter pixel won't catch storage moving six inches on a steep-banked reservoir, and a weekly pass isn't going to flag an afternoon spill event. For a desk modeling basin-wide hydro supply over a season rather than hour-ahead dispatch, that trade is usually worth making. For most of these basins, there's no finer-grained public alternative to compare it against anyway.
Where the two disagree
Most weeks, they don't, within the limits above. The exceptions are worth naming specifically. A reservoir posting a flat gauge reading while its satellite-derived area is visibly shrinking usually means the operator is holding the published stage steady, or just not updating it, while actually drawing storage down for generation or a downstream delivery obligation. That gap is often the earliest public signal a basin's supply picture has shifted, well before any disclosure catches up.
The reverse case matters too. Reservoirs with reliable gauges but complicated bathymetry, river-run projects with heavy seasonal sediment shifts, long drowned-valley reservoirs with a lot of fetch, can show a satellite-derived volume that drifts from the gauge-implied one simply because the area-capacity curve needs resurveying. That's a real limit of the imagery approach, and any desk using it should track confidence reservoir by reservoir rather than treating a whole watchlist as equally well-characterized.
Which one to use
If a public gauge feed exists, is current, and covers the dam you care about, use it. It's higher precision and it costs nothing. Satellite-derived storage earns its keep on everything a gauge network doesn't reach: foreign basins, utility-owned assets that treat storage figures as proprietary, and any reservoir where the last public number is a year-end summary filed on someone else's schedule.
Reservoir Monitoring runs that second path, turning a weekly water-surface polygon into a storage-level series per reservoir across a global watchlist, so a desk isn't stuck choosing between a stale annual report and no number at all. If your basin coverage has holes where gauge data won't reach, it's worth seeing what the imagery fills in.