What is a reservoir rule curve, and why hydropower traders watch it
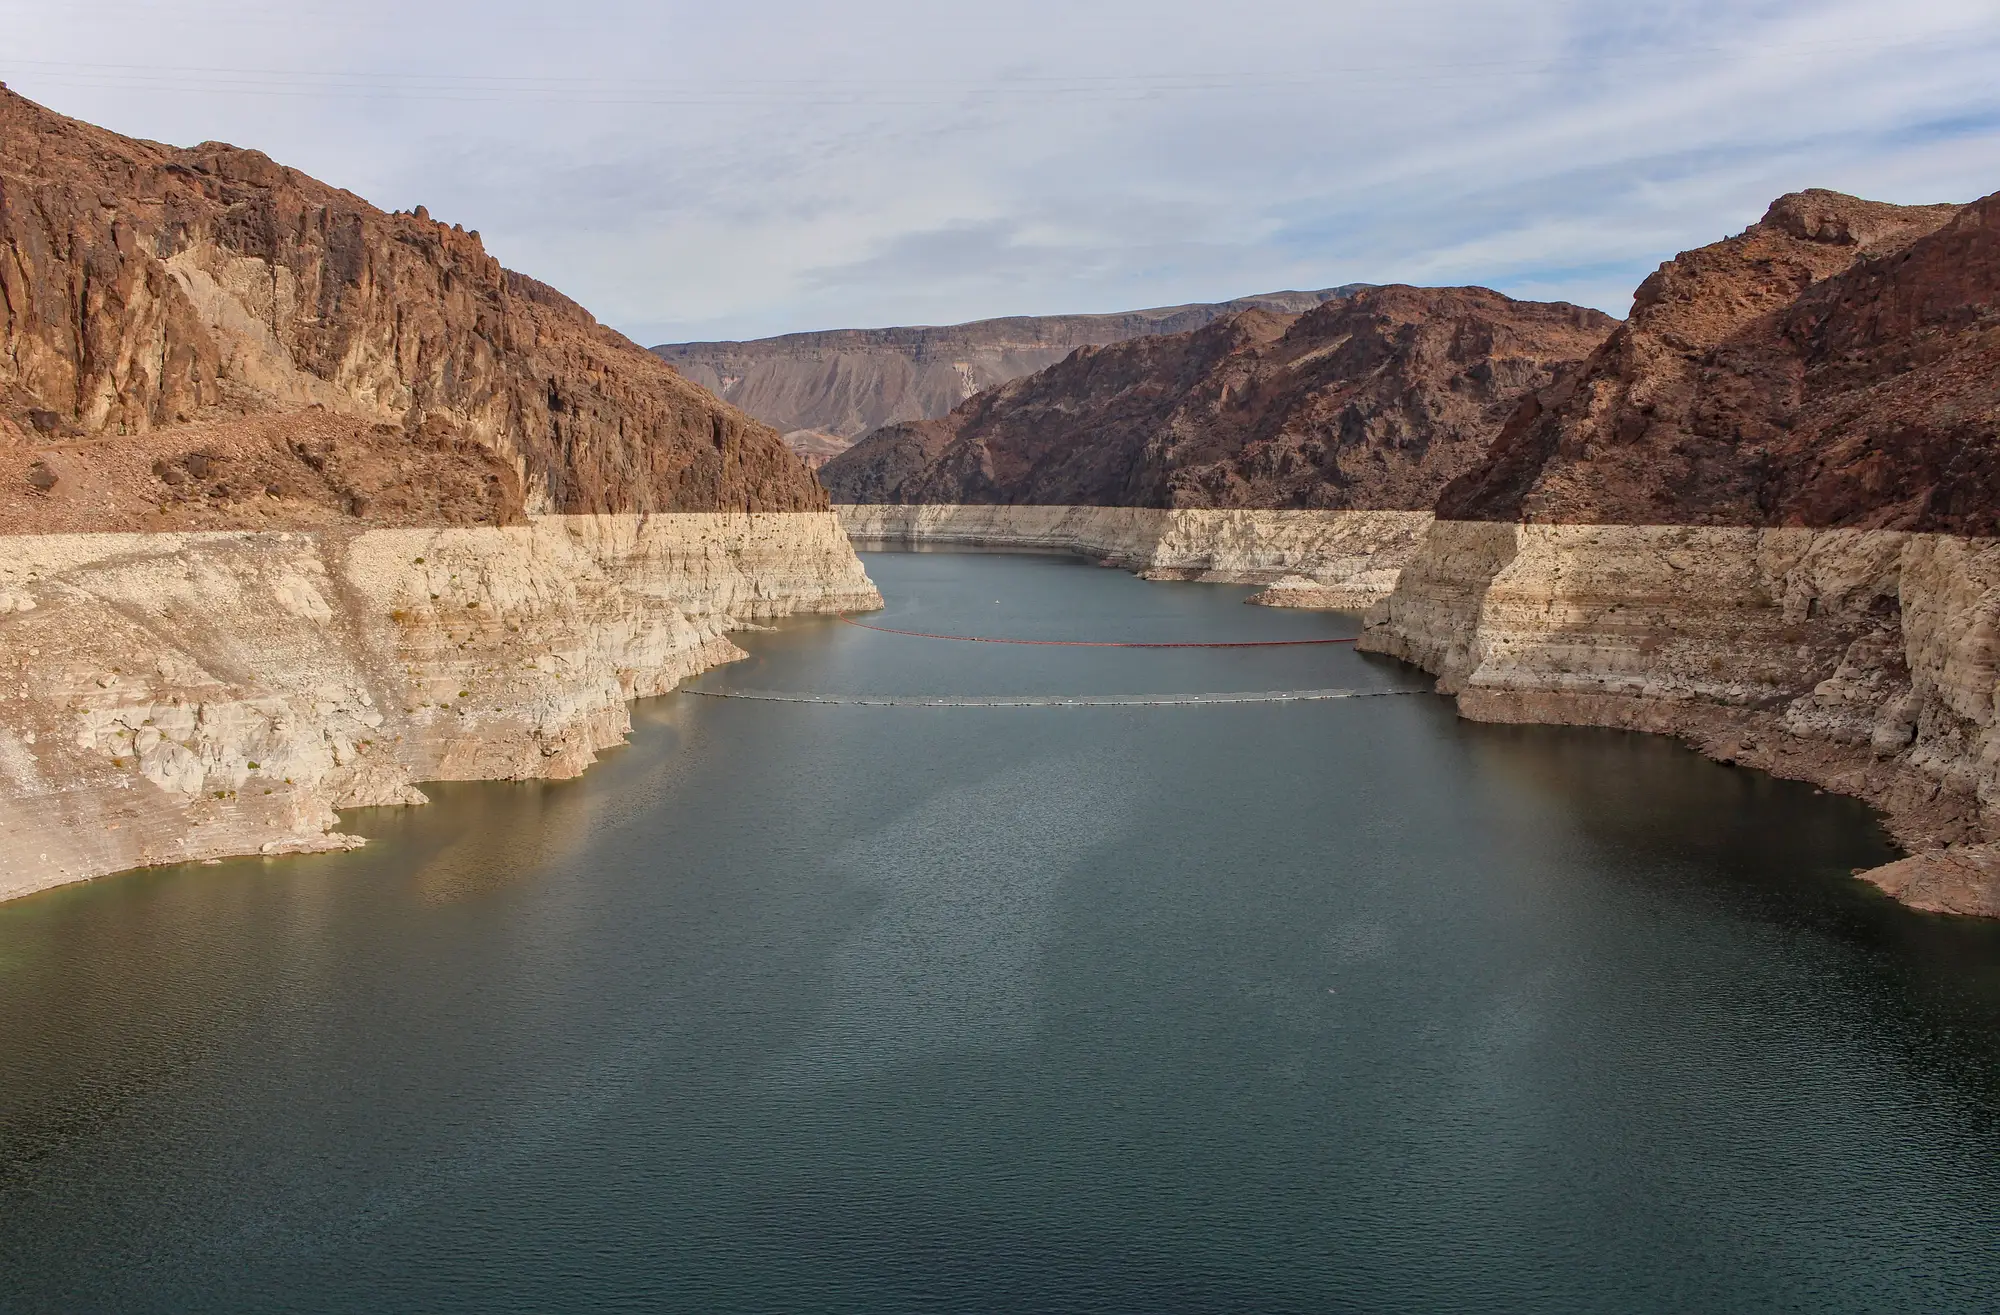
A rule curve is the operating guide a dam agency publishes for how a reservoir's pool should move through the year. It sets the target elevation, or a band of elevations, for each week or month, splitting the pool into two functional pieces: the flood control pool, which has to stay empty enough to catch a flood pulse, and the conservation pool, which holds water for power generation, irrigation, municipal supply, or navigation. Some agencies call the whole schedule a guide curve instead of a rule curve. Same idea, different name depending on which basin you're in and which agency wrote the manual.
Picture the Army Corps curve for a flood-control reservoir in the Columbia or Missouri system. Through late winter, the curve pulls the pool down to make room for spring snowmelt. Through summer, it lets the pool refill into the conservation pool for the generating season. The curve itself is public. The problem for anyone trading around it is that the actual elevation on any given week is not.
Why the curve alone doesn't tell you where storage sits
A rule curve tells you where the reservoir is supposed to sit each week. It says nothing about where the reservoir actually sits right now, and that gap is where the trading question lives. Snowpack runs heavy or light against forecast. An operator draws down early ahead of a storm that never shows up with the expected volume. A utility holds water back longer than the guide curve suggests because spot prices are strong and they'd rather generate into that market than spill.
None of that shows up until the agency's next disclosure, and disclosure cadence varies wildly. Some basins post daily gauge data. Others, especially outside the US and Canada, post monthly bulletins, quarterly reports, or nothing a trading desk can get to before the number is stale.
That lag is the whole reason desks watch the curve as closely as they do. Comparing current elevation against the rule curve band answers one question: is this system running wet, dry, or on schedule relative to the plan the operator committed to. Above the curve and climbing into summer means more generation capacity sitting in storage than the schedule assumes, which tends to pressure forward power prices down in that zone. Below the curve going into a dry season points the other way, and the size of that gap between actual and scheduled elevation is usually what the desk is pricing.
Reading flood control pool and conservation pool separately
The two pools behave differently, and conflating them is a common mistake for anyone new to a basin. The flood control pool is a risk buffer. It exists to be empty at the right time, and its size is set by hydrology and engineering standards that rarely change year to year. The conservation pool backs generation directly: its fill level relative to the guide curve is the number that correlates with how much the operator can run without drawing the pool down past its comfort zone.
A reservoir sitting right at its rule curve in March, at the bottom of its flood control drawdown, tells you almost nothing about generation capacity for July. A reservoir sitting ten feet above its guide curve in July, deep into the conservation pool, tells you the operator has more cushion than the schedule assumed and less incentive to buy power to cover a dry spell later in the season. Desks that trade basin-wide hydro exposure, rather than a single plant, build their read of a whole system this way: curve by curve, reservoir by reservoir, watching which ones are running ahead of schedule and which are falling behind.
The catch is getting elevation or storage data often enough, and across enough reservoirs in a portfolio, to run that comparison before it's old news. That's the gap Reservoir Monitoring was built to close: it turns each reservoir's current water-surface area into an estimated stored volume using the reservoir's own area-capacity curve, refreshed weekly across a watchlist you set, so you get a storage series to put next to the published rule curve without waiting on a disclosure schedule the dam owner controls.
If rule curves are the plan and disclosures are the lag, pull your own weekly storage read for the basin and skip the wait.