What is an area-capacity curve, and how does it convert into reservoir storage?
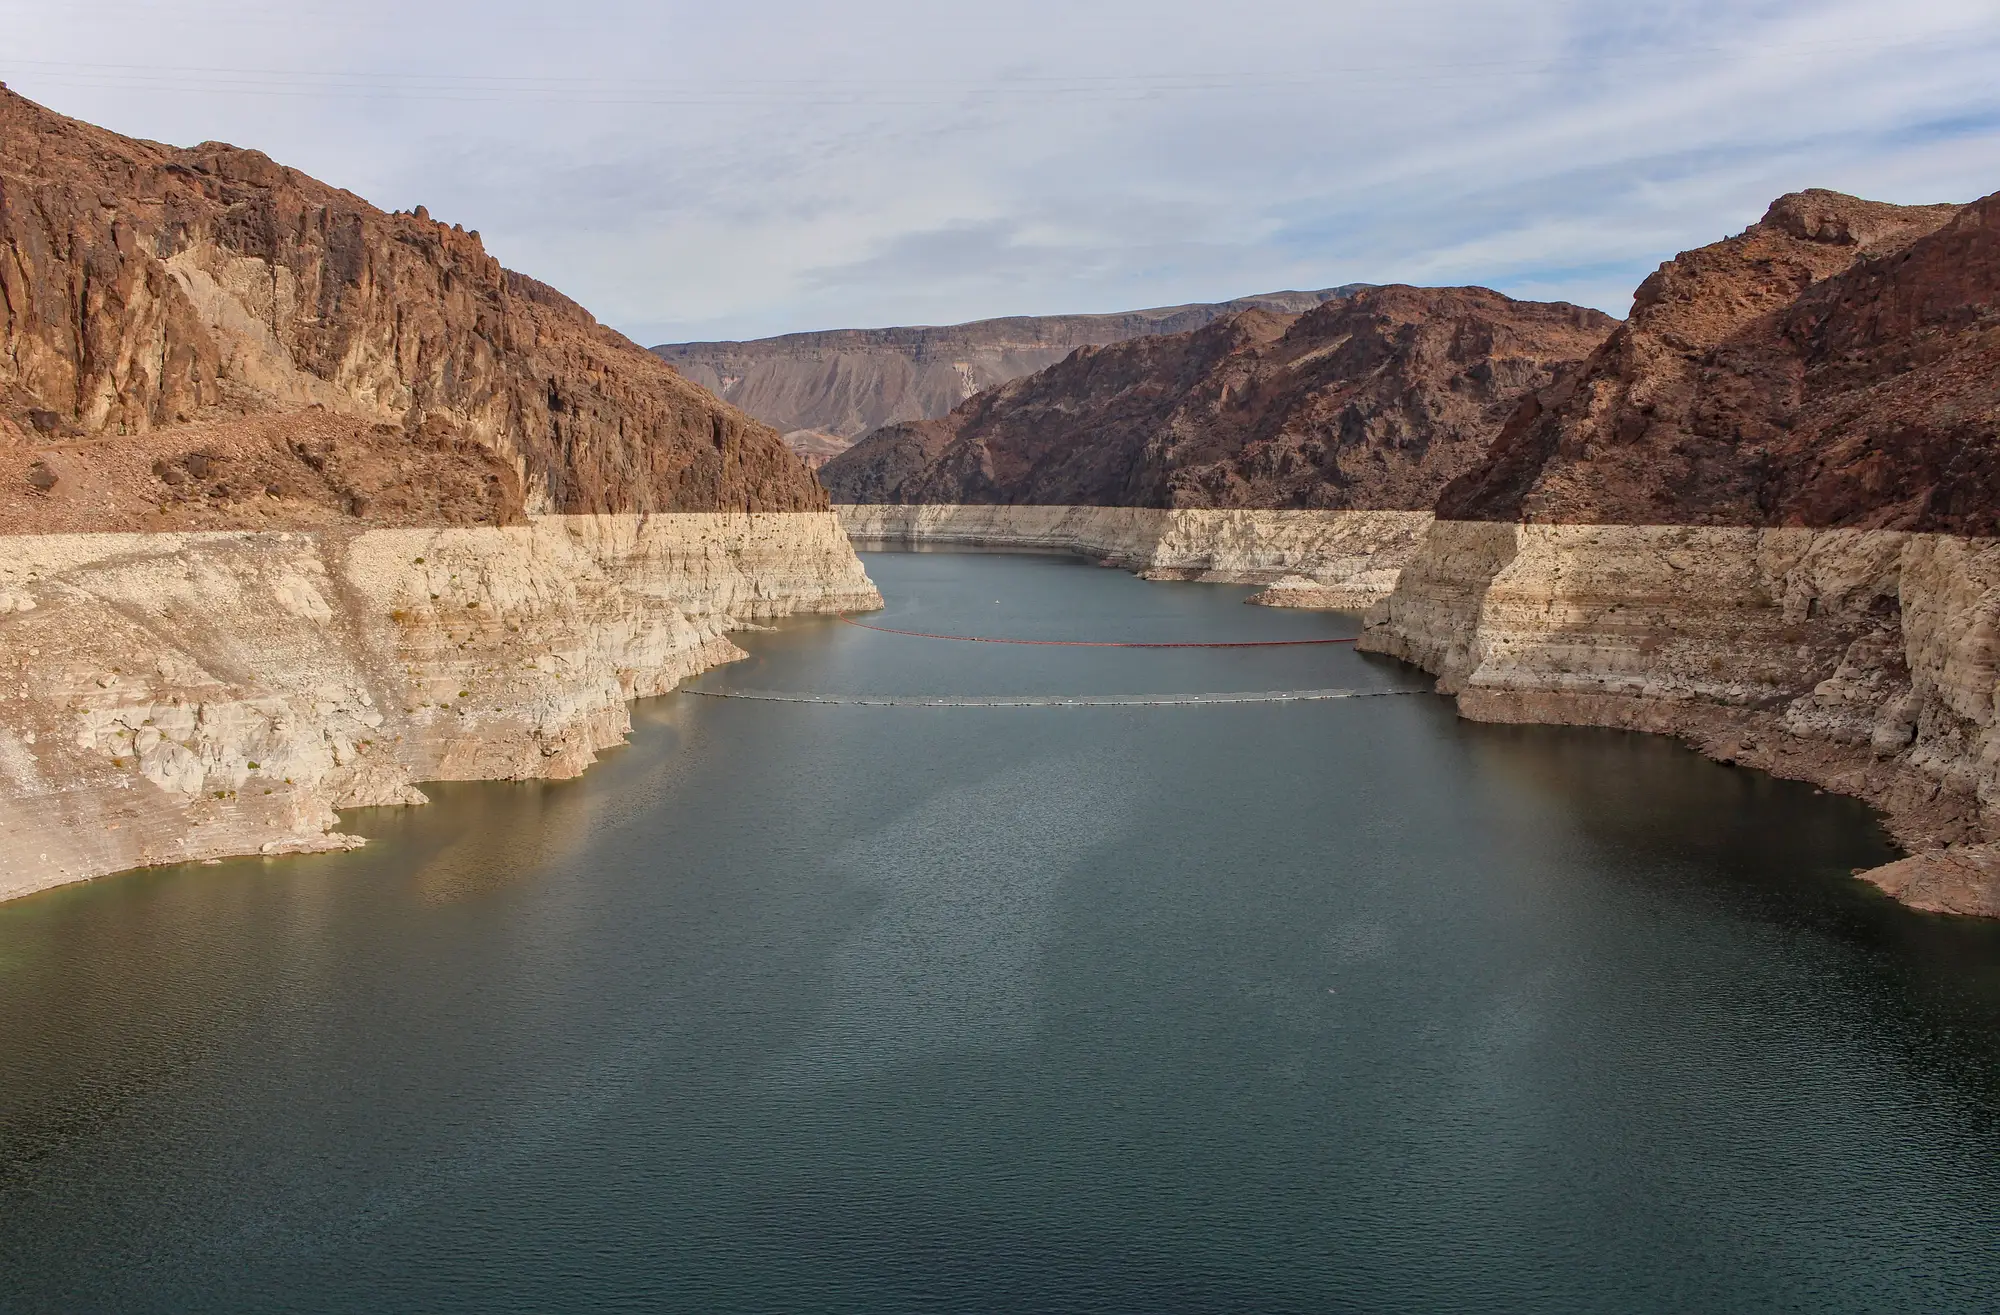
An area-capacity curve is the relationship between a reservoir's water-surface area and the volume of water stored behind the dam. Plot area on one axis and cumulative storage on the other, and you get a curve that lets you convert one into the other without draining the lake to check. Some agencies call the same thing an elevation-capacity curve or a stage-area-storage relationship, because surface area and water-surface elevation move together as the pool fills or drops. Dam engineers sometimes call it a reservoir bathymetry curve, since the shape of the curve is really just the shape of the basin turned sideways.
The logic is simple once you've seen it drawn out. A reservoir basin is wider near the top and narrower near the bottom, like most bowls carved by a river valley. So the same one-foot drop in elevation represents a lot more lost volume when the pool is full than when it's nearly empty. A linear reading of "surface area down 5%" tells you nothing about storage on its own. You need the curve to translate that area change into an acre-foot number, or a cubic hectometer number if that's how your basin reports it.
How the curve actually gets built
Utilities and dam owners build these curves from a bathymetric survey, usually done once at construction and occasionally updated by a follow-up survey after a decade or two of sediment buildup. A survey crew (or more often now, a sonar-equipped boat or airborne LiDAR pass) maps the basin floor at a known pool elevation, then engineers run that terrain model through software that slices it into elevation bands and sums the volume in each slice. The output is a lookup table: at this elevation, this surface area, this cumulative storage. Everything downstream of that table, every daily storage report a utility publishes, every drought bulletin a basin authority puts out, runs through this same conversion.
The catch for anyone trading around hydropower generation is that the curve is almost never public at the resolution you'd want, and the underlying survey can be ten or twenty years stale. Reservoirs silt in. A curve built in 2008 assumes a basin shape that may no longer exist, especially in basins with heavy upstream erosion or frequent flash flooding. The area-to-volume relationship drifts over time, slowly in most years, less slowly after a major sediment event. Nobody resurveys forty dams a year to keep every curve current.
Why the curve matters more than the headline number
This is the part that gets lost when people talk about "storage data" like it's one thing. A utility's published storage figure and a surface-area measurement from imagery are two different inputs feeding the same curve. If you can observe the water-surface polygon on a regular cadence, which is a lot easier to pull than official storage disclosures that lag by days or weeks, or get withheld around contract negotiations, the curve is what turns that polygon into a number you can actually trade or dispatch against. Without it, you're stuck eyeballing a shoreline and guessing whether it's up or down from last month.
That's the gap Reservoir Monitoring is built to close: it takes a reservoir's water-surface polygon from wide-swath satellite imagery, runs it against the basin's area-capacity curve, and produces an estimated stored-volume series, refreshed weekly, for a watchlist of dams you don't own and don't get disclosures from. You're not waiting on a utility's PDF or a stale annual report to know whether a basin is filling or drawing down.
If your desk is pricing hydropower generation off rainfall proxies and last quarter's reservoir report, it's worth seeing a weekly storage series run instead.